Building on the 34 years of wave height measurements by satellite and the capabilities of the new SWOT satellite, a study published yesterday on PNAS reveals a new record for the highest ocean waves ever measured in the open ocean and how these giant waves are formed. A commentary on the new findings with insights from Fabrice Ardhuin, lead author of the paper.
The paper “Sizing the largest ocean waves using the SWOT mission” published in the journal PNAS investigates the storms that make the biggest waves and their evolution into swells of very large periods. The study found that the biggest waves are generated in particular storms: those in which the region of high winds moves at the same speed as the waves, feeding them the energy needed to make them higher and longer. This concentrated wave energy only holds together for a few hours, before dispersing as swell across ocean basins.
This original research builds on a previous storm catalogue that used a numerical wave model to lists all the storms with heights over 10 m from 1991 to 2024. These models estimate wave heights up to 23 m in the storm Ronadh which occurred in January 2014 in the North Atlantic. “Since 1991 we have had data on wave heights from 15 satellites, but until December 2024, these measurements did not exceed 18,5 m. However, this does not mean that the model overestimated the wave heights, because the satellites only sample a very small part of the ocean and, in general, they miss the peak of the storms, passing on the side of the storm or at a time before or after the climax of the storm” says Fabrice Ardhuin, senior researcher at IFRMER and first-author of the new study on PNAS and co-author of the storm catalogue. “Indeed, the model used in the storm catalogue is only 0.3 m above the satellite data at the location and time of the measurements. So, without any measurement, how do we know if the 20 or 23 m given by the model are realistic?”
Fortunately, on December 21, 2024, SWOT flew over the center of Storm Eddie just as wave heights were reaching their peak. SWOT is equipped with two instruments. The first one is Poseidon-3C a conventional radar altimeter similar to those used on previous satellites. SWOT’s Poseidon-3C measured a new record: a height of 19.7 m (averaged over 50 km along the satellite track).
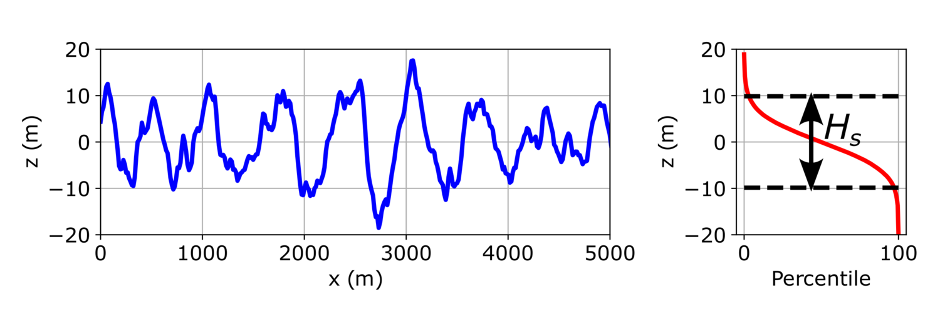
Satellite radar altimeters like the Poseidon instruments on the Jason series or on SWOT only measure the power of echoes as a function of distance from the satellite, over a region of a few kilometers in diameter. These altimeters do not measure the detailed shape of the sea surface (on the right). The power echo as a function of distance is related to the cumulative surface height distribution: we get a mean value (the sea level) and a spread of the surface elevation. The significant wave height is defined to be 4 times the standard deviation of the surface elevation. On these schematics the Hs value is 19.7 m, the largest ever measurement from 1991 to 2024, in storm “Eddie” on 21 December 2024.
But SWOT’s main instrument is KaRIN: a radar system that produces detailed images of the surface using synthetic aperture technology, and associated water heights using interferometry. This makes it possible to “see” the waves and measure their height, length, and direction. So even if it does not pass over the center of the storm, SWOT samples the swell escaping from it, making it possible to trace the properties of the waves at the center of the storm and better understand their formation. SWOT observed the formation of the swell and its propagation over a distance of 24,000 km, from the North Pacific to the tropical Atlantic, between December 21, 2024, and January 6, 2025.
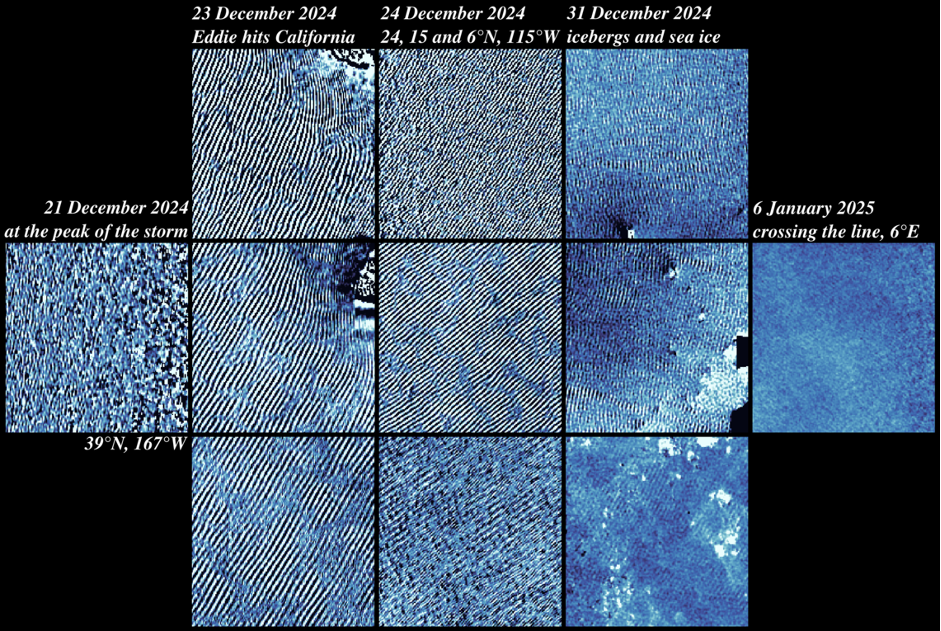
Each tile is 40 by 40 kilometers and shows the sea surface elevation at 250 m resolution, with visible “fingerprints” in the form of swells, all from the same storm Eddie. For the left tile the dynamic range is -1 to +1 m, the other tiles use -0.1 to +0.1 m. Further exploration of these data using the Ocean Virtual Laboratory: https://odl.bzh/GwbPr7lS
Ardhuin explains that all researchers and engineers working on waves use the empirical form of the “JONSWAP” spectrum but that several studies have already proposed modifications for dominant waves and shorter waves. The new results imply the need to to significantly correct the shape of this spectrum for the longest waves.
“Looking at swells from 10 storms measured by SWOT in 2023 and 2024, we always find a sharp decrease in the swell height as a function of distance from the storm. Because long waves travel faster than short waves, the observation of swell height away from the storm gives a decomposition of the storm sea state into a “spectrum” of the different wave periods in the storm, exactly like a prism decomposes light into the colors of the rainbow. The only plausible explanation for the SWOT swell height decay is thus a particular shape of the wave spectrum in the storm, with a very steep roll-off towards long periods” says Ardhuin. The problem, explains the researcher, is that the spectrum shape needed to explain the SWOT measurements is very different from the “JONSWAP spectrum” that is generally used by oceanographers and engineers. Right now, it is not clear if this updated spectrum is generally true, or if it is only specific to extreme storms.
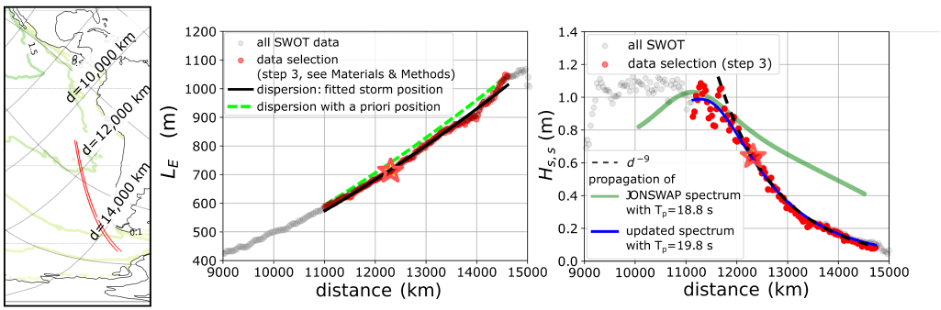
Swell data from storm Bolaven as measured by SWOT (track 328 on 24 October 2023), 8 days after the storm: the left panel shows the location of the measurements (in red) used to fit a swell model to the data. The center panel shows a mean wavelength as a function of the distance from the storm center d. Each dot corresponds to an area 40 by 40 km. The increase in wavelength as a function of d agrees with the theory of wave dispersion from the location and time of highest wave heights according to a model (green curve). Fitting the theoretical dispersion (black curve) gives an estimate of the time and location of the storm center. The right panel shows swell heights. The sharp decrease of swell height like d-9 is not consistent with the usual JONSWAP spectrum. An update to the JONSWAP spectrum is needed to explain the data (blue curve).
First evidence of “energy cascade” for such long waves
Ardhuin explains that the spectrum correction based on swells measured by SWOT is consistent with the wave-wave interaction theory formulated by Klaus Hasselmann in 1962: waves with the most energy transfer it to slightly longer waves, enabling them to reach phenomenal heights. This is the first evidence of this “energy cascade” for such long waves. “These observations will be used to improve weather forecasting models and knowledge of extreme waves, which is important for offshore and coastal construction: swells have caused several casualties and extensive damage from Canada to Peru, thousands of kilometers away from Storm Eddie. It will be necessary to understand whether the proposed spectrum correction can be verified with other observations and whether it applies to all storms, not just the most intense ones” says Ardhuin.
Potential practical applications
The methodology applied in the study can be useful in a wide range of engineering and geophysical applications for which wave periods are essential parameters. These include the design of structures and adaptation to climate change, in particular in coastal areas, but also the interpretation of sedimentary records and the analysis of yet unexplained seismic signals.
The work was supported by the European Space Agency (ESA) as part of Phase 2 of the Sea State Climate Change Initiative and the Centre National d’Etudes Spatiales (CNES).