Analyzing SWOT data collected during three extreme weather events, a paper published on Geophysical Research Letter demonstrates the capability of SWOT to capture the spatial structure of storm surges across diverse oceanic regimes. Results confirm how SWOT represents a major advancement in coastal oceanography, with strong potential to improve scientific understanding, risk assessment, and long‐term coastal resilience. An interview with Diego Vega-Giménez, first author of the study.
The paper “Expanding the Coastal Observation Frontier: SWOT Reveals the Spatial Footprint of Storm Surges” published on Geophysical Research Letters used SWOT data to observe, for the first time, extreme weather events driven by atmospheric forcing in three distinct scenarios in the open-sea and coastal domains.
The work used data from the SWOT fast-sampling phase (1-day repeat orbit) and from the SWOT science phase (21-day revisit time) and focused on three locations in the Baltic Sea, North Sea and Gulf of Mexico where SWOT overpasses coincided with storm surge events and independent validation data (tide gauges, ERA5, and model outputs) were available.
Improved estimation of sea level rise during extreme events
Storm surges are rapid and abnormal rise in sea level typically caused by severe storms and are the result of the combination of different processes. In the Baltic Sea, SWOT satellite passed over the Kiel tide gauge station 178 times between March 2023 and March 2025. This location is characterized by a micro-tidal regime. Satellite data showed the presence of two extreme weather events and SWOT provided a more accurate estimation of sea level rise in respect to numerical model outputs when compared to tide gauges.
“SWOT performed significantly better because it provided a direct snapshot of reality that the model simply could not reproduce. We have to realize that numerical models are theoretical functions limited by their input data. While a model might resolve the dynamics well in the very short term, as the simulation runs over time, it inevitably starts to deviate from reality. This happens because the model cannot fully resolve very high-frequency processes, like rapid wind gusts or minute interactions with complex bathymetry. Over time, these small, unresolved processes add up, and their cumulative effect generates a general shift or error in the total water level” says Diego Vega-Giménez, first-author of the study and PhD candidate at Universitat de les Illes Baleares, in the Mediterranean Institute of Advanced Studies (IMEDEA).
“SWOT, instead, measures the integrated result of all these physical processes, it is observing the actual state of the ocean at that instant. It captures the sea level resulting from high-frequency interactions and topographic constraint that the model smoothed out or missed along the way. That is why SWOT’s estimation was more accurate, it gave us the ‘ground truth’ that included all the physics the model lost over the duration of the run” says Vega-Giménez.
Instant observations of sea level rise following rapid wind bursts
In the North Sea, the SWOT satellite passed over the Alte Weser tidal gauge 60 times between its launch in December 2022 and January 2025. This location is characterized by a macro-tidal regime. Indeed, the open location of the North Sea allows storm surges to develop over a broader spatial extent introducing additional complexity, that lead to higher discrepancies between both numerical model and SWOT measurements in comparison to observations in the Baltic Sea location.
“The high energy of the North Sea’s macro-tidal regime led to significant discrepancies. For the event on February 1st, 2024, our model underestimated the surge, simulating a maximum of roughly 95 cm located far offshore. In contrast, SWOT detected 160 cm right at the coastline, capturing a critical water pile-up that was completely absent from the model ” says Vega-Giménez.
Hydrodynamic models are often forced by atmospheric data (like ERA5) that is smoothed in time and space, typically hourly and at 0.25-degree resolution. Because of this ‘smooth’ input, the models tend to decrease the response to rapid wind bursts, effectively underestimating how fast and high the water rises. SWOT, by contrast, captures the ocean’s response to these rapid atmospheric changes instantaneously. It detects the sharp, non-linear rise in sea level that occurs when a storm intensifies quickly. Essentially, SWOT validates the existence of these rapid, extreme peaks that the current forecasting systems might be smoothing over.
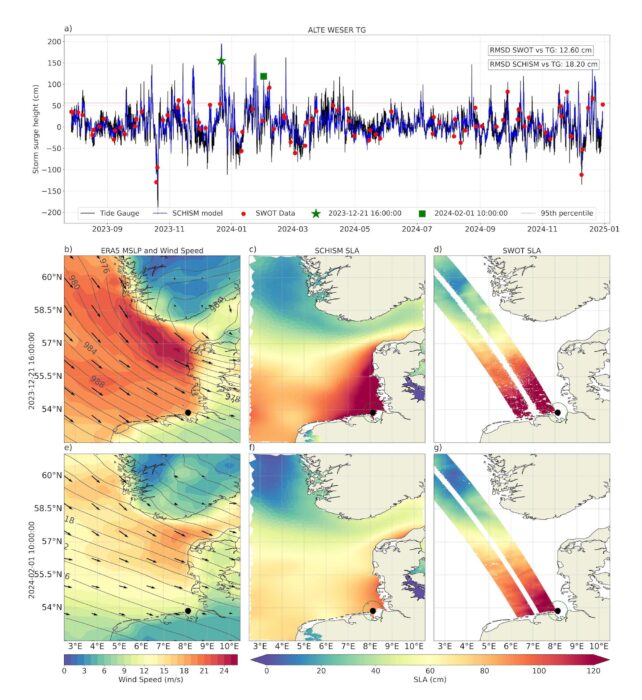
SWOT performance during North Sea storm surges. a) Comparison of surge heights at Alte Weser tide gauge. The panels below show the meteorological conditions (b,e), modeled surge (c,f), and detailed Sea Surface Height from SWOT overpasses (d,g) for two specific high-energy events, demonstrating the satellite’s ability to resolve coastal surge dynamics. Copyright: D. Vega-Giménez.
Detecting water pile-up during the development of an hurricane
In the Gulf of Mexico, SWOT satellite intersected eight times the path of the Milton Hurricane during the 5 days in October 2024 in which Milton remained active in the region. Originated in the western Gulf of Mexico, Milton generated intense storm surges along the south-western Yucatán Peninsula, resulting in extreme sea level changes in some locations, with significant impacts to coastal infrastructures.
SWOT gathered critical observations at different stages of the development of Milton. “The most groundbreaking observation was near Ciudad del Carmen. Traditional altimeters are typically ‘blind’ within 20 km of the coast due to land interference, but SWOT shattered that limitation. It successfully detected the water pile-up inside the adjacent lagoon where it measured a rise exceeding 120 cm at specific regions within this confined water body. This proves SWOT can monitor complex coastal systems like lagoons and estuaries where the flood risk is often highest but where previous altimeters gave us no high density data” says Vega-Giménez.
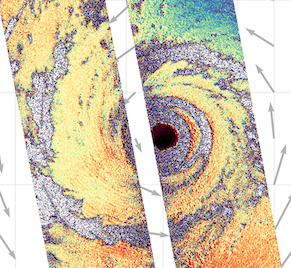
“Secondly, near Isla Mujeres, we observed the hurricane’s spatial structure in its most intense phase. The satellite track cut directly through the eye of the hurricane. It allowed us to see the instantaneous shape of the surge as it was being created, linking the intense atmospheric pressure and wind gradients directly to the ocean response from the deep sea all the way to the shelf.”
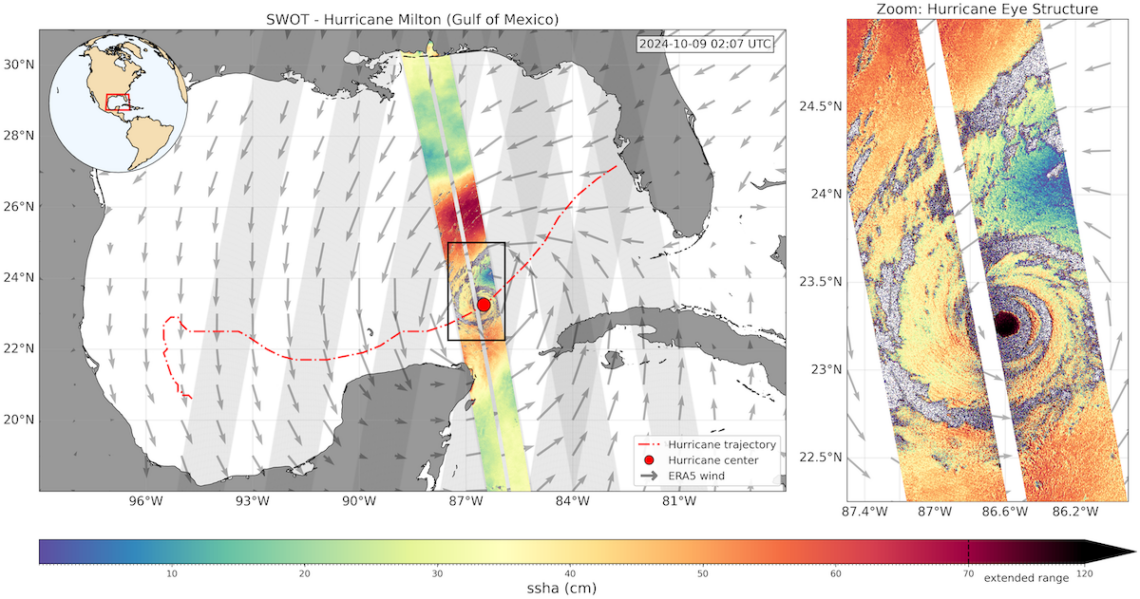
SWOT overpass over the Gulf of Mexico during the development of hurricane Milton (red track) (left). Detail of Sea Surface Height (SSH) from SWOT and the intense cyclonic structure surrounding the eye of the hurricane, revealing extreme SSH anomalies in the core (right). Copyright: D. Vega-Giménez.
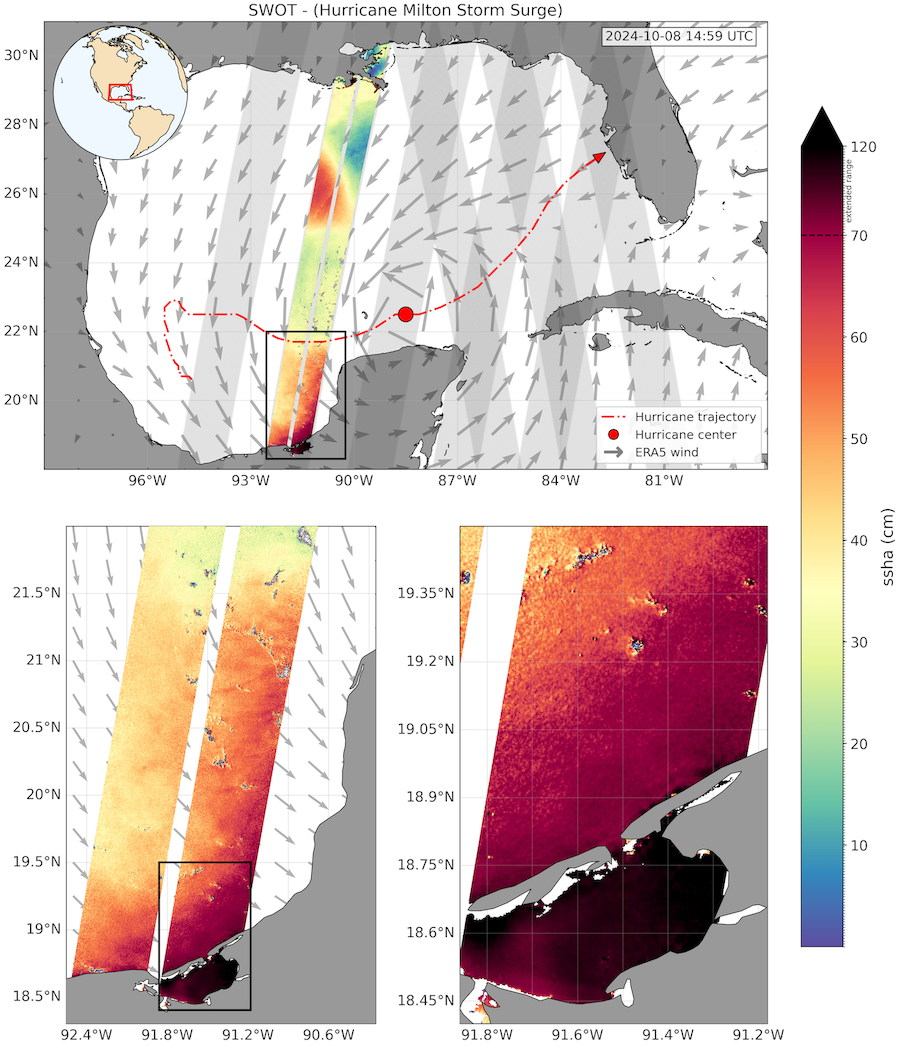
SWOT observations capture the storm surge entering the Lagoon during Hurricane Milton (upper panel). The zoomed panels highlight the extent of the surge off-shore (left) and the detection of >120 cm anomalies inside the lagoon (right), proving the satellite’s capability to monitor flood risks in complex estuaries. Copyright: D. Vega-Giménez.
New opportunities for weather forecasting where coastal observation facilities are missing
With the advent of satellite altimetry, it became possible to estimate the spatial signal of storm surges, providing a broader view of sea‐level anomalies caused by storms. Despite these advances, traditional altimeters have limitations, particularly in their spatial resolution.
This work proved that SWOT can monitor complex coastal systems where the flood risk is often highest but where previous altimeters gave us no high density data. This is a revolution in how satellite altimetry can estimate the spatial signal of storm surges and can be particularly useful in regions of the world which lack coastal observing infrastructures.
“Although we must acknowledge that the 21 day revisit time limits continuous monitoring, the combination of ascending and descending passes effectively reduces this interval to approximately 10 days. This improved sampling works best within a multi platform synergy where SWOT provides the broad spatial context while tide gauges fill the temporal gaps with high frequency data and models offer predictive capabilities. This capability, combined with future reductions in data latency, paves the way for integrating SWOT into early-warning and model-assimilation systems, significantly enhancing global coastal resilience” says Vega-Giménez.
Citation: Vega-Gimenez, D., Amores, A., Paris, A., & Pascual, A. (2025). Expanding the coastal observation frontier: SWOT reveals the spatial footprint of storm surges. Geophysical Research Letters, 52, e2025GL117299. https://doi.org/10.1029/2025GL117299
Contact: Diego Vega-Giménez
